Sunday, January 08, 2006

Sometimes more is less...

2005 was a bumper year for teams batting first in ODIs. Not only did they win over 55% of the games, 21 times they managed to score 300 or more (11 times going on to score more than 325). This is the highest both in terms of numbers and % of games played (21 of 107) over the years. The previous highest was in 2002 when 19 teams scored 300+ in 147 games...


Wow, you will say, this is great. It means that the One-day game is getting more exciting. Fours, sixes (the works basically) and this is what we what to see.

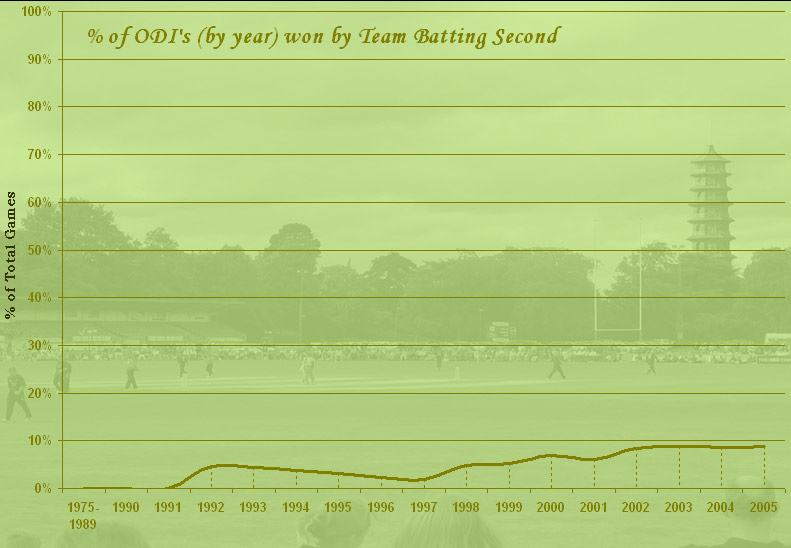
Well, not exactly especially when you look at the number of times the team batting second has actually crossed 300 in the same games...


As you can see, teams batting second still haven't mastered the art of chasing high scoring games. The result is that the number of teams that win chasing a score of 300 or more is still very low.


(this is a cumulative % and excludes games won on D/L method).

Also, not only do teams batting first (scoring 300 or more) win over 90% of the games, the average margin of victory stands at a staggering 101 runs!

I agree that when teams batting second do win or get close to the target (like the two games between NZ & Aus in December) the games tend to be great, but these games are few and far in between a load of one-sided encounters.

So at half time the 9/1 odds may look favourable, but don't be fooled and bet on the team batting second (not yet anyway).

Sadly, the only people who think that more is not less are the adminstrators who run this game. Bring on more Powerplays, I say, and see the % of 300+ scores shoot through the roof but don't put your money on an exciting game.

Anyway (on a slightly different note), its not all doom and gloom out there, as this suggests.


The number of ODIs being played over the years seems to be finally heading south and I hope its not just a blip...

postscript:
Just watching the current Twenty20 game between South Africa and Australia. The first thing that stuck me was that the boundary ropes had been brought in to enable more fours and sixes. Unfortunately, all it did was create another one sided contest. At the end of the day, be it Tests, ODIs or Twenty20, if cricket is not an even contest between bat and ball, it ceases to be a contest. But watching the crowd cheer Pollock hit fours and sixes when South Africa need 150 runs in 50 balls makes me wonder!!! Maybe, I am in the minority here and cricket has indeed become a game of individual brilliance, the result be damned...

Saturday, January 07, 2006

No Black on White, no stats, but some story that...

And with a heavy heart, but on public demand, I have the changed the colours on this blog. On hindsight, I do a agree with this neutral colour theme.

Anyway, while I run around trying to find some more interesting stats, here is something for the weekend; my not so serious attempt at writing.

Hope you like it.

Friday, January 06, 2006

Twenty20

I belong to the (old) school of thought that says if you want to win a Test match, you first pick up a bowling attack that can get you twenty wickets before picking up the batsmen who can score 500 runs.

So, IMO, a better bowling attack is the one that has a "better" potential to take twenty wickets in a Test.

I made this point during the recent Ashes and showed how England had an edge over Australia in the bowling department and hence were better placed to take wickets. And in hindsight, it wasn't such a bad analysis :-)

Now, our very own "Bhai bhai Ashes" is being billed as the contest between the Pakistani bowlers and the Indian batsmen, thus giving the impression that the Pakistan has a "better" bowling attack than India.

Question is; is it? Lets see...

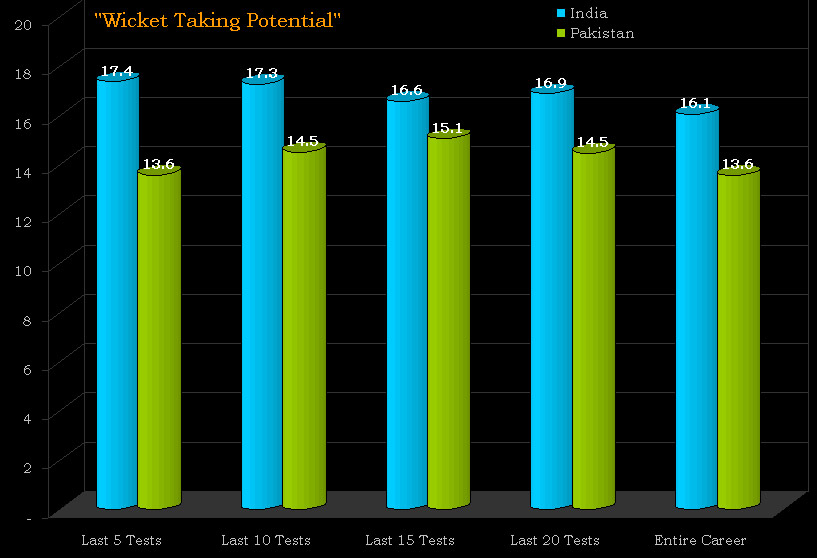
To determine which is the better, I have analysed both bowling attacks based on their "Wicket Taking Potential" (WTP, to coin my own abbreviation), which is the simple addition of the Wickets per match statistic of their front line bowlers.

I have assumed that the bowling attack for India will consist of Pathan, Kumble, Harbhajan and Zaheer (sorry Agarkar) and Pakistan will go with Akhtar, Sami, Naved and Kaneria.

Also, to get a better spread for analysis, I have determined the WTP based on the records from the last 5, 10, 15, 20 Tests and entire career. (Except in the case of Naved, who has only played in 7 Tests and Pathan, in 18).

Here it is...


As you can see, the Indians, on any given 5 days, can take about 3 more wickets that the Pakistanis thus making them a "better" attack.

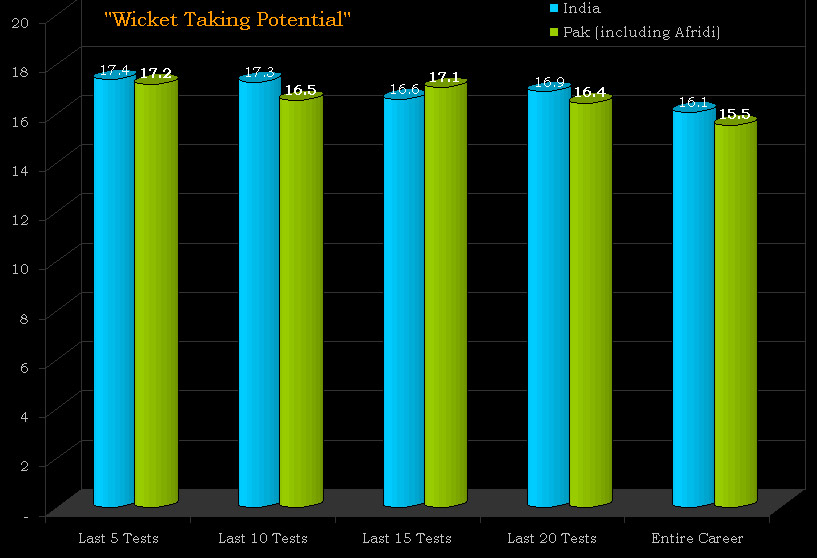
Have I missed something here? Ah, yes! While I can chose to ignore part time bowlers like Malik, Shewag, Tendulkar and Yuvraj (ok Ganguly as well), Afridi is too good a bowler to ignore, as India found out at Bangalore last year.

So what does his inclusion do to the Pakistani WTP? This...


Though India still have their noses ahead, the difference becomes negligible. However, the balance now tilts in favour of Pakistan because (again old school thought) a five man bowling attack is better than fou
r.

Now, this WTP analysis ignores an important aspect that also determines the quality of a bowling attack. It is the bowling average (number of runs given per wicket). Needless to say, if both bowling attacks have the same WTP, the one which gives away less runs wins.

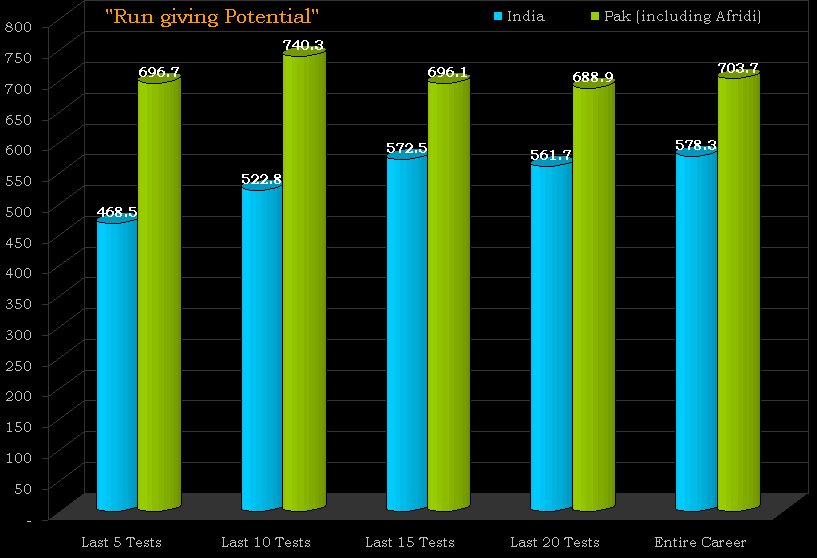
I have used the bowling averages to determine the potential runs a bowling attack is likely to give away while taking 20 wickets, i.e. I have multiplied the bowling average with wickets per Test for each bowler, added it for the entire attack and normalised it to twenty wickets (for example, if India gives 340 runs to get 17 wickets, they will give 400 runs to get 20).

So how do both the bowling attacks compare in this department?


So no matter what the pundits say, reverse swing or not, I think the Indian bowling attack is miles ahead of Pakistan.

Having said that, when Akhtar steams in to bowl to Sehwag, all this counts for nothing...

postscript: Sometimes you don't need 20 wickets to win as the Aussies demonstrated today. In fact, this is the 11th time that a team has declared in the 3rd innings of a Test and lost. And the third time when a team has declared both its innings and lost (including the famous famous Cronje game at the centurion when South Africa scored 248/8 and then forfeited one innings along with England, and England scored 251 for 8 to win).

Wednesday, January 04, 2006

Serious Cricket Anyone?

I take it that the BCCI have finally got fed up with the amount of games it is forced play against the likes of Zimbabwe and Bangladesh and are ready to challenge the ICC'’s 10-year Test schedule. The reason? They want to start playing serious cricket. Secretly, all the other major Cricketing nations are nodding their heads in agreement and are backing the BCCI. After all, thatÂ’s what their fans, players and sponsors want to see, don'’t they?

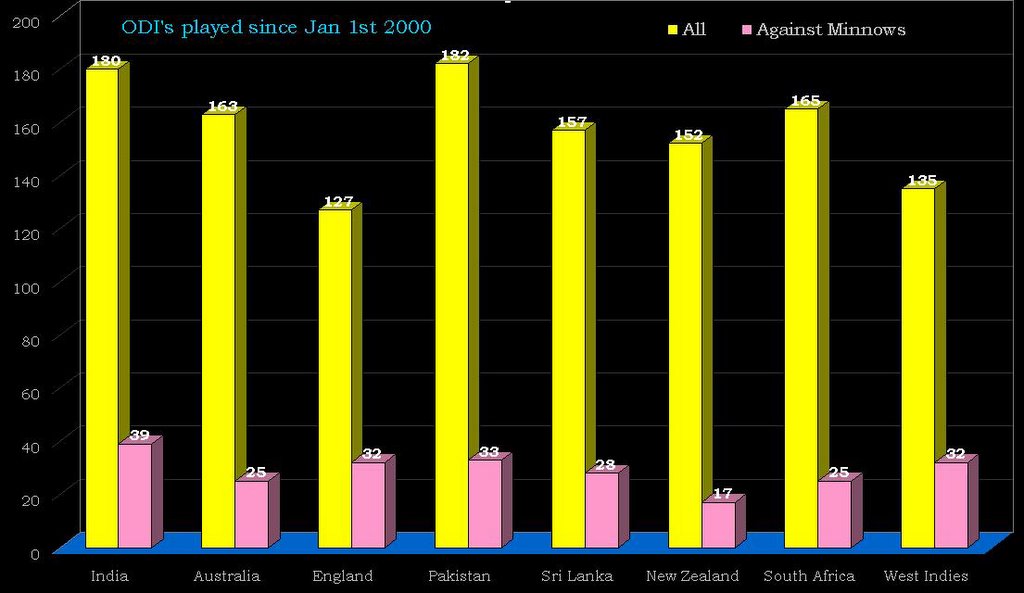
As fans, we should all rejoice that the BCCI is ready to take a sensible stand, on behalf of us and the rest of the cricketing world. However, before we decide to open the champagne and celebrate, it will be interesting to look back and see how much meaningless cricket (against the minnows) the ICC has '“forced'” down our throats in the last six years.

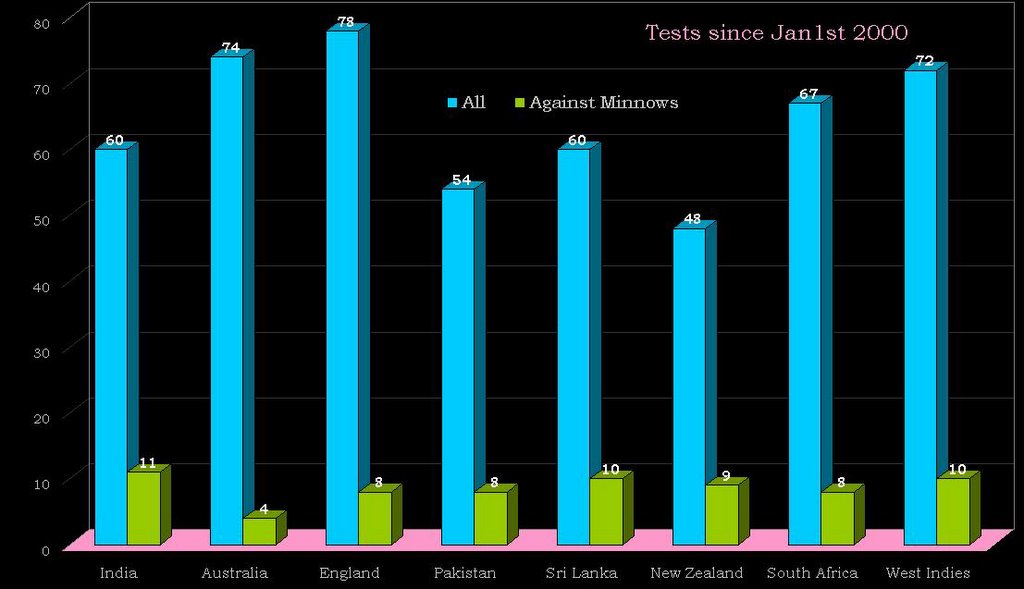
I have done a brief analysis of all ODIs and Tests played by each country since Jan 2000. (click on all images to get the bigger picture).

First, the number of ODIs played by country


As you can see, India leads the pack, closely followed by Pakistan, England and the West Indies.


And now the Tests played, again by country…
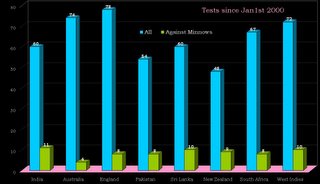


Again, India leads the pack, which is even more surprising considering the amount of Test cricket we play.

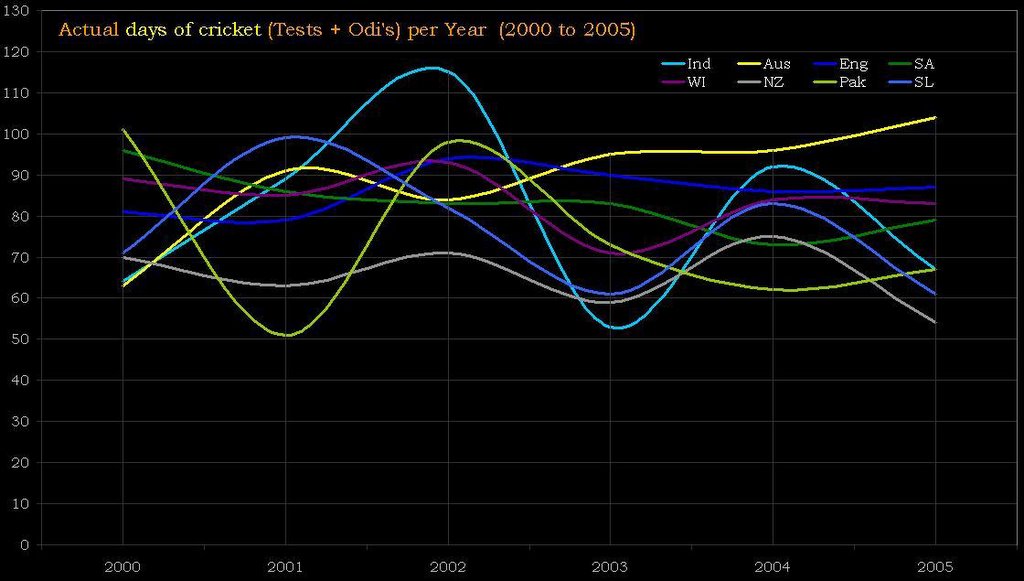
Now combining the figures, we get the average days of cricket played per year (assuming 5 days of Test cricket, which is a bit rare against Minnows, but never mind).


Again no surprises there.

While you look at this chart, ask yourself this question; if the sub continent is indeed the centre of the cricketing World, why do India, Sri Lanka and Pakistan play less cricket than say West Indies, where the game is all but dead! Don'’t expect an answer anytime soon.

Ok before I proceed, apologies if I made you believe that India consistently plays 80 days of cricket every year. Just to clarify, this is the actual number of days of cricket being played (by country) every year since 2000, and as always, India continues to dominate both, the low and high ends of graph.
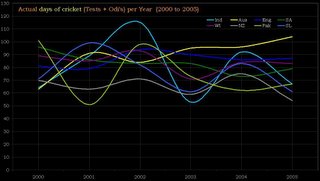


Pakistan probably has a genuine reason for an inconsistent schedule (due to security concerns after 9/11, etc) but how the BCCI managed to schedule 115 days of cricket in one year, and 53 the very next is beyond me! But I had made this point in one of my earlier posts, so I will pass.

Some of you may look at these numbers and say, yes India is on top because we play more cricket but overall as a percentage, we cant be that bad, can we?

Here is the answer.


And hence they are upset, and may I remind you, with the ICC.

Now if only the BCCI had bothered to find out how the other countries manage to play more cricket (and that to consistently) and less of the meaningless cricket in question, and yet adhere to the ICC'’s policy (however stupid it may be)?

But I guess it'’s a lot easier to pick up the phone and make a call across the Arabian Sea and shout foul.

Anyway, I do hope the BCCI knows what to do with the spare time once they decide not to play Zimbabwe and Bangladesh. After all, the next team to visit India after England (in Mar 2006) is Zimbabwe in October 2007, followed by West Indies in 2008!!! (Talk about Home advantage for the next two years)

So if India decides not to play Zimbabwe at the end of next year, we may not have any team visiting India for the next two years, unless we can convince someone to come down and fill in he gap. But last I checked, not many countries seem to have the spare time in their busy schedules. Well, there is always Bangladesh from across the border, but…

I guess the BCCI really donÂ’t care about this 2 year gap. They just want to play cricket (as long as it is meaningful) and if they can make the money via TV rights, what is the need to host cricket in India as all. With 70% of the tickets given away as passes, the real fans donÂ’t get to see the games anyway, so why bother with the logistics of hosting games for a few thousand rupees in gate receipts.

Anyway, in case you want to mark your calendars in advance (so as to stay away from your Television sets), according to the ICC schedule, India have to visit Bangladesh, host Zimbabwe and visit Zimbabwe in the next 5 years. A WHOLE 30 days of pointless Test cricket!!! As opposed to the 65 days of Test cricket that was forced upon us in the last 6 years.

Damn, I deviated in this post, as my point really was about the ICC and the crap it forces down the throats of the like of the BCCI, and not about the BCCI itself.

Never mind…

Sunday, January 01, 2006

Catch me if you can...

For a few years now, the rest of the cricketing world has been trying to catch-up with the Aussies. One of the (many) areas the Aussies have been ahead of the others is in scoring hugh first innings totals and that to an an alarming run-rate.

So, how do the other countries compare with the Aussies, and is the gap finally closing?

Here is the comparision of Run rates and Average runs per wicket (by year) between the Aussies and their opposition (in head to head games).


I know there is the Ashes factor in 2005 but can we hope to see the gap closing further in 2006?

Another vital stat to look out for this year...

The Punter and the Wall

They both started their careers within 6 months of each other and in similar fashion with scores of 95 & 96 respectively.

When they first came face to face, they had scored 193 & 187 runs respectively (with 2 fifties each).

When they last met (in the ICC-XI Vs Aus "TEST" in 2005), they had both added over 7,000 runs to their names and were playing their 92nd and 94nd Test Respectively. And at the end of last year only 13 runs and 0.90 points in their average seperated the two.

And yes, both bat at Nr. 3, have 58 & 59 Fifty-plus scores in Test cricket, and also captain their respective sides.

Have their been any other players in Test Cricket whose careers have been so closely linked? Lara and Sachin come to mind...

Anyway, will be fun to see who gets to 10,000 first. I am tempted to put my money on Punter, now that he is finally ready to go over the wall, but I wouldn't like to bet against the Wall either...

Saturday, December 31, 2005

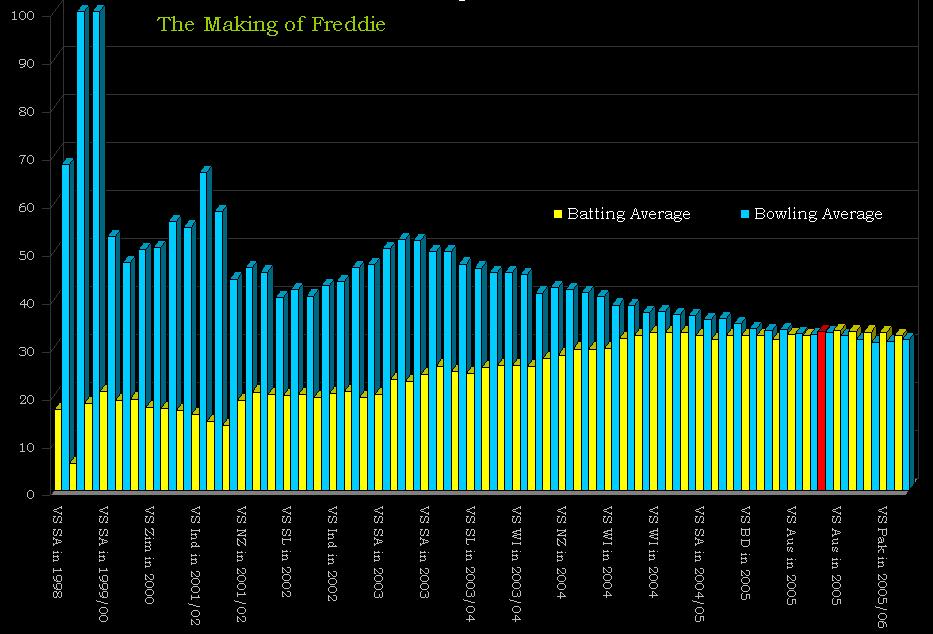
The Making of Freddie

It took seven years for him to fulfill his potential, but most (including the Aussies) will agree it was well worth the wait.

From being the Next Botham in 1998, to the Fat Lad in 2000 and finally World Beater in 2005, this is his journey over the years.


ps. The Red line indicates the point when his batting average finally overtook his bowling average (the hallmark of a Genuine allrounder).

Friday, December 30, 2005

35 years, 323 days and counting (down)...

There is nothing sadder then watching a great player struggle at the end of his career, and they don't come any greater than the Pigeon himself.

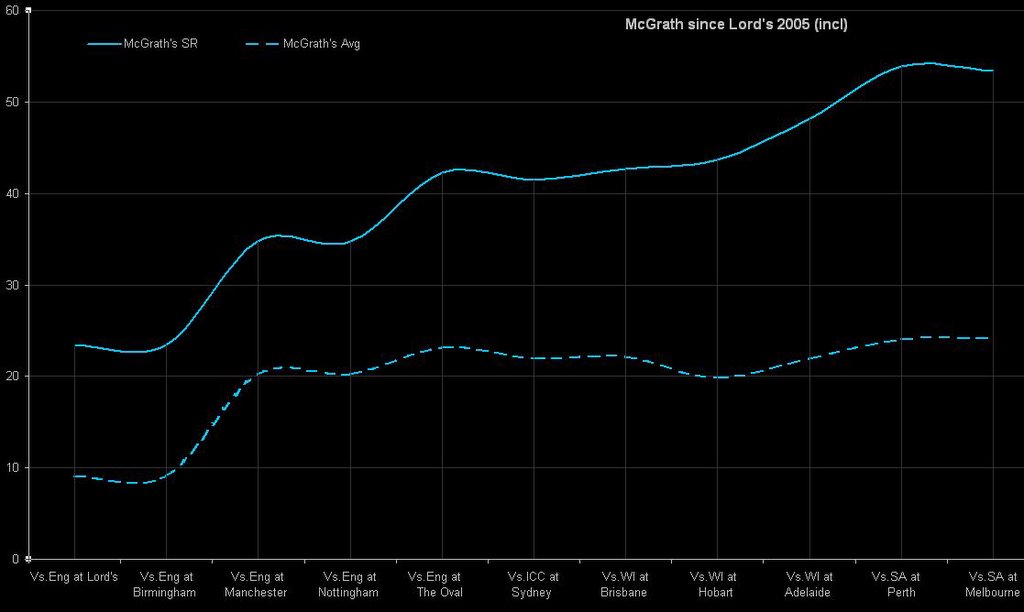
Six months ago, McGrath was Australia's undisputed strike bowler (of course along with Warne) but since coming back from his freak injury after Lord's 2005, his Strike Rate and Bowling Average has been on a decline.

Though he did finish the Melbourne Test with 4 wickets, he has taken just 31 wickets in the last 9 Tests (excluding Lord's) at SR of 62.13 and Average of 28.52 (compared to a career SR of 51.3 and Average of 21.44). But more importantly, he rarely looks like taking wickets these days. His is not accurate (one of his biggest strengths) and he is (now) just a line and length bowler who can be taken apart.

Question is, will he realize his time is up, or will he prove me wrong with another "5 for nothing" performance at Sydney next week? Either way, I will be surprised if he is still around for the Ashes next year, let alone the World Cup 2007.

Anyway, here is his Cumulative Strike Rate and Bowling Average since Lord's 2005 (included)...


(click on image to view)

Thursday, December 29, 2005

SRT Vs SG (again)

I know its a few days old, but I came across this article by Ashok Mitra in the Telegraph, so couldn't resist.


(click on image to view)

Now if only someone could point Mr Mitra to this blog so he can shut up, once and for all. In case he still misses the point (or the lines), SG's Average since the World cup excluding the Minnows is 27.08 (as opposed to SRT 42.31). Or in other words he has scored 1083 runs in 40 completed innings compared to Sachins 1,777 in 42 (again excluding the minnows). And no, his stats including the minnows dont get any better either....

Walk (but don't hop) like an Aussie!

More Spaghetti here, but this time of the shorter version.


(click to view larger image)

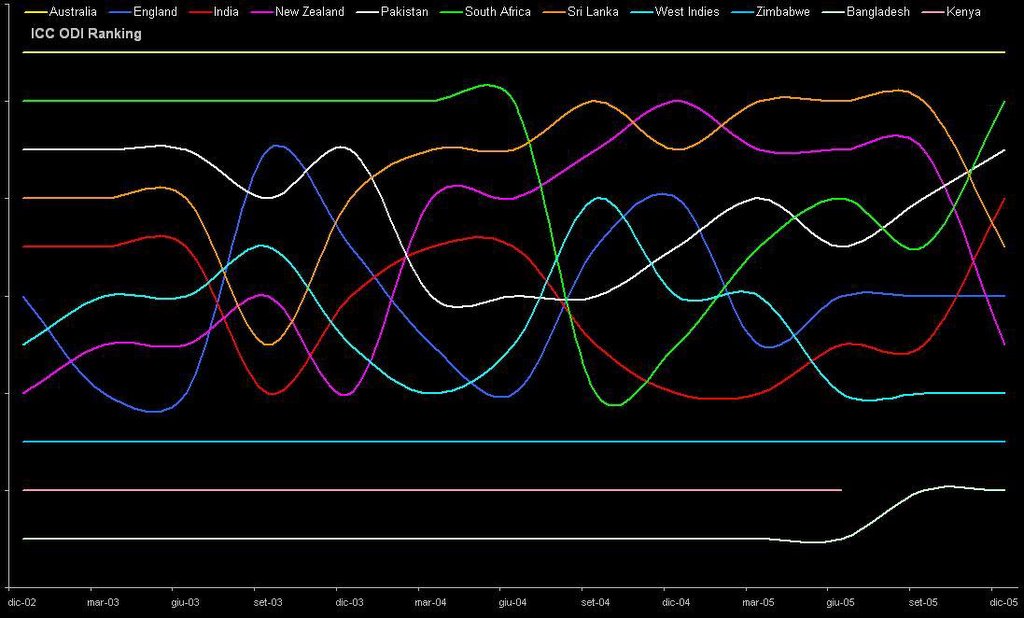
Nothing special if you look at this in isolation. However, if you merge India’s ranking in the ODI’s with that of its Test Ranking during the corresponding period, you get an interesting picture.


(click to view larger image)

Is it pure coincidence that India's ODI and Test Performances have finally began to move upwards, and more importantly, merge since Greg Chappell took over?

ps. Apologies, my laptop is still acting up. and I am working on an Italian computer, hence the Months are in Italian. But you get the point. I hope...

Wednesday, December 28, 2005

Break-down

Guys,

Sorry for ignoring the blog these last few days. I am on Skiing holiday in the Italian Alps but worse, my Laptop's gone kaput. While the former was a welcome and planned break, the latter definitely wasn't.

And while I am busy trying to sort out my Skiing and the Laptop (both of which can be, on a cold icy day, a real pain in the backside), here is wishing you all a (Belated) Merry Christmas and a Happy New Year...

Thursday, December 22, 2005

One more to go...

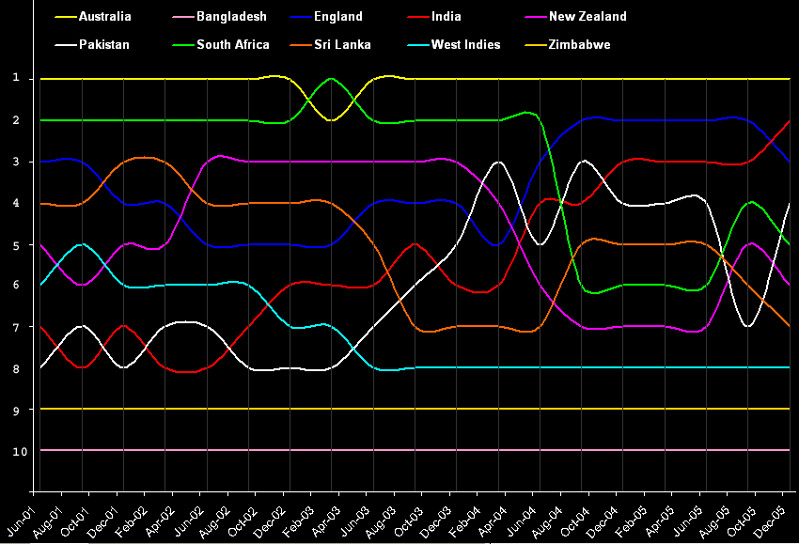
So India has finally reached the Nr. 2 spot in the ICC Test Championship (which indecently is the only Sporting Championship in the world without a Winner).

While we all know that India is some way away from reaching the top, lets not forget that India’s progress in the last four years (in Test cricket) has been remarkable.

Here is the journey of the various Teams since the ICC Test Championship was introduced in 2001. Looks like Spaghetti to me, but that could be because I spend too much time in Italy....

(Click on the image to view)

Tuesday, December 20, 2005

Poor Warney

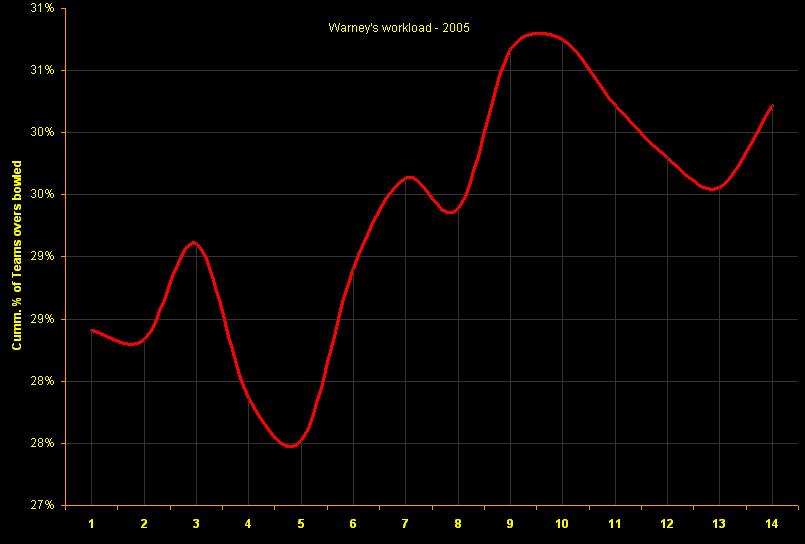
So Warney's got every right to be worried that there are "some blokes" out there who bowl from one end all day and will eventually break his record.

After all, he only got to bowl 37% of his Team's overs in this match, which interestingly is being played in Perth (today, he 'merely' bowled 39% of his Teams overs, i.e. 35 overs).

And not to forget that he only got to bowl 33% of the overs during the Ashes (toping at 39% at the Oval in the last Test).

Anyway, a quick look at Warne's increasing workload this year (Given that the Aussie bowling attack looks more like that of the Lankans, I think its not just Warne who needs to be worried here).


Sunday, December 18, 2005

India's Most Valuable Player

He is, in my mind, India's Nr. 1 Match winner of all times. Sachin, Rahul, Kapil & Sunil; take a bow.

And on the eve of his 100th Test, his strike rate over the years...

(click on image to view)

Friday, December 16, 2005

Games BCCI plays

No, I don't mean the political ones, but the ones it has sent "Team BCCI" to play since the 1990/91 season (Home and away).

If only they spend less time on playing "Games" on a regular basis, and more time playing Regular games...

(click on image to view)

Thursday, December 15, 2005

Ganguly and the BIG-3

While Ganguly's own performance dipped since he became captain, that of Dravid, Tendulkar and Kumble definately improved under him.

Was he plain lucky to have them in his team or did he really know how to get the best out of them? Guess we will never know...

Anyway, a simple graphic showing how the BIG-3 performed under Ganguly.

(click on image to view)

Wednesday, December 14, 2005

Milestones

Came across Dravid's milestones on Midday
Could not resist a comparison with his contemporaries

(click on image to view a larger version).

Saturday, November 19, 2005

Can SA Defend 169 Today

Look at these stats and judge for yourself...

(All these stats are for Games that have been 45 oer or more and excludes No-results)

1. In only 20 out 300 games has a team defended a total of less than 170 in a Game.

2. South Africa has done it thrice:
Against WI in 92/93, Capetown (SA 140, WI - 136 all out)
Against Eng in 95/96, East London (SA 129, Eng 115 all out)
Against England in 2000, Joh'brg (SA 149, Eng 111 all out)

3. In India, the only time it has happened was when Kenya defeated WI in the 1996 world cup (Kenya 166, WI 93 all out) .

4. The lowest total India failed to chase in India was against WI in 1987/88 in Guwahati (It was a 45 over game) (WI 187 in 45 overs, Ind: 135 all out)

5. The Lowest Total SA have defended in India was 214 against SL in 1993/94 in Guwahati (SL 136 all out)

6. The Lowest Total SA have defended against India (in India) was 249 in 1996/97 in Jaipur (India ended on 222/7)

7. The lowest Total SA have defended against India (home and away) is 235 in Kenya in 1999/00 (India finished on 209/10)

8. Average First Innings score at Bangalore is 255!

9. The lowest total defended in Bangalore is by England in 1993 (Eng 218/9 in 47 overs, India 170 all out)

Tuesday, September 20, 2005

400,000 runs and more Stats!

When Strauss hit Lee for a 4 in the 57th over of the first innings of the Oval Test, the English score moved to 223/4 (Strauss to 97 and Flintoff was batting on 44). What is significant about this is that it was the 400,000th run scored by England in Test cricket!!!

And in the second innings, when Peitersen eaised Warne through cover for a single in the 46th over, England moved on to 172/5. Again what is significant about this score is that it was the 400,000th Test run scored in England by all Test Teams including the Neutral SA/Aus games played in 1912. If you exclude these games, the total stands at 397,937. That means, the 2063 runs required should be scored sometime in the series against Sri Lanka next year.

Watch out for another 400,000 milestone for England!!!

Another interesting stat: When Trescothick flicked Anwar Hossain Monir of Bangladesh for a single in the 1st Test at Lord’s to move to 149 (eng 335/1), it was the 100,000th Test run scored at Lord’s in games involving England!

And talking of Bangladesh, they are also created a ‘bit’ of history by taking the 50,000th Test wicket. It happened in the 1st Test at Dakha between Bangladesh and West indies in the 2002/03 series. And it wasn’t a bowler who took that wicket, but a fielder who ran out Darren Ganga on 40 (West indies 417/6).

Friday, September 02, 2005

New Zealand: 278/9. Can India Win?

Statistically speaking, highly unlikely!

Why?

Because of the 55 times India has been set a target of 275 or more in a 50 over match, they have lost 46 times and won only 8 times (one was a no result). A Win/Lose ratio of 0.174 does not look promising!

Against New Zealand, they have only won once chasing more than 275 (in 1988/89 at Vadodora chasing 281) and lost 3 times (1995/96 Nagpur, 1998/99 Christchurch and 1999/00 Rajkot).

And to make it worse, they have won only once chasing the 275+outside the sub-continent (against england in the famous 2002 Natwest finals) .

And if 270+ seems too much, here is some more stats regarding run chases:

Chasing 250+, won 25, Lost 83.
Chasing 260+, won 18, Lost 65.

If I were a betting man, I would bet on India losing this game. But they say, cricket is a funny old game....