Thursday, October 01, 2009
Tuesday, February 07, 2006
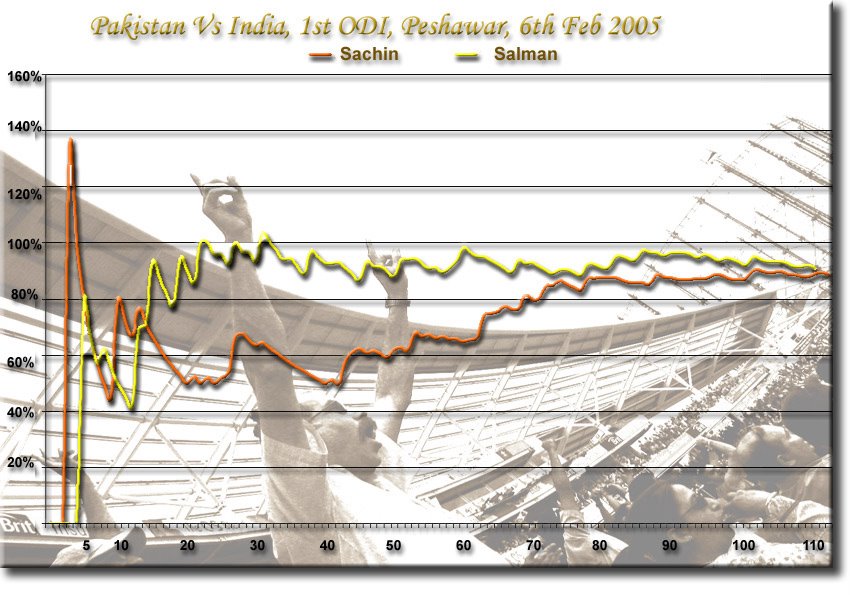
Sachin Vs Salman
Record books will show that Salman Butt and Sachin Tendulkar scored similar centuries in the 1st ODI at Peshawar yesterday. While both ended their innings with a strike rate of around 90 (Sachin 100 of 113 balls, Salman 101 of 111 balls), their innings were far from identifical...

(click on image to enlarge)
And yes, in case you havent noticed, I am back...
but only briefly as I head to India for a much needed holiday!
(click on image to enlarge)
And yes, in case you havent noticed, I am back...
but only briefly as I head to India for a much needed holiday!
Sunday, January 29, 2006
In suspension
Hello all,
Will not be able to post regularly for the next few weeks as I am extremely busy with work, travelling etc.
Aplogies...
Will not be able to post regularly for the next few weeks as I am extremely busy with work, travelling etc.
Aplogies...
Sunday, January 22, 2006
Predicting the Predictable - II
I believe that ODIs follow a predictable pattern and, as the title of this post suggests, the aim of this and the previous post is to prove the same. And since this is a continuation of the previous post, I would strongly recommend anyone who has not read that post to do so before reading any further.
In the previous post, I had highlighted some of the most important attributes and also, in my opinion, flaws of the one day game, namely:
Fair enough. Frankly, even I had my doubts before I started this analysis couple of weeks ago. Since then, I have analysed the One-day game to see if the above mentioned attributes do exist and are common to ODIs in general. I did this by grouping ODIs together based on different parameters.
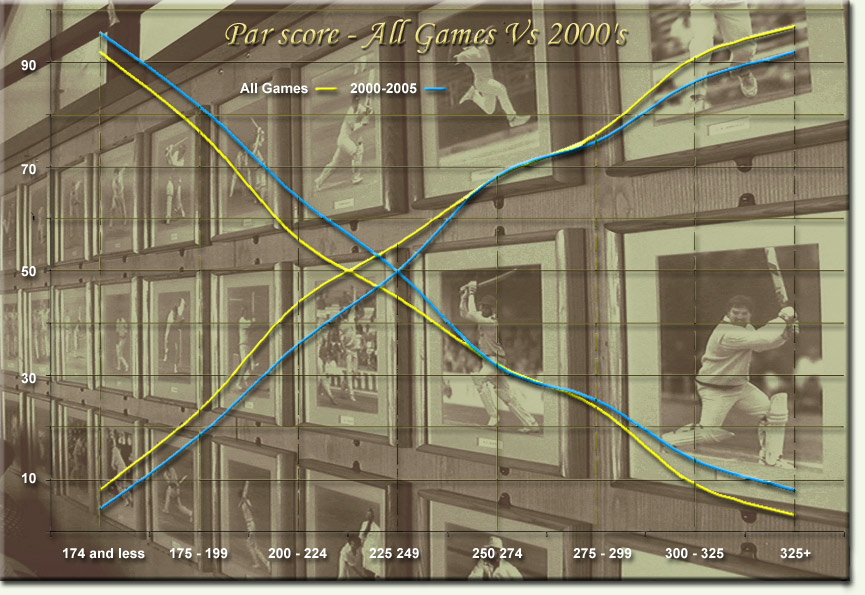
First, here is a comparison of games played in this decade (2000 thru 2005) with all games played since 1971.
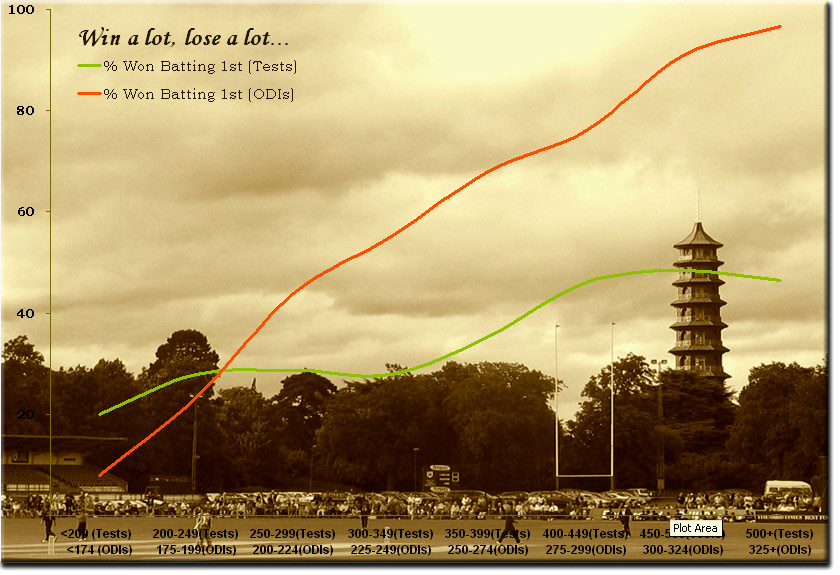
Note, as mentioned in my previous post, these graphs do not include games decided by the D/L (or similar) method, less than 45 overs (as they distort the numbers) and those that did not finish in a +ve result (i.e. "No Results" due to rain). Also note that in this (and all graphs), the line going from bottom left to top right represents the % times the team batting first has won after scoring the runs represented in the "x" axis, and vice versa. This gives us a par score (50% chance of winning or losing) where the lines intersect.
 (Please click on this and other graphs to enlarge)
As you can see, apart from the difference in the par score, both those graphs are similar. And as expected, the par score in the games is a bit higher for games played in this decade.
Now, given the fact that ODIs in the sub-continent are normally higher scoring than the rest of the world, I split the games between those played in the sub continent and elsewhere and did a similar comparison...
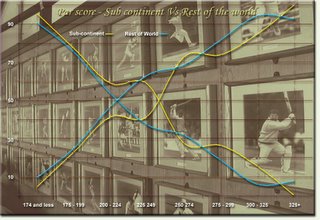
The sub-continental graph does appear "wonky" but on close inspection, it exhibits exactly what I am trying to prove, i.e. outside of the par score, the result becomes predictable, and in this case, its just more pronounced. And again, as expected the par score is higher for the sub-continental games. Guy who might still be holding their sheet of paper tick or cross your answers :-)
I was also aware that this split based on regional lines may not be correct, as not all grounds in the sub-continent are high scoring and vice versa. In order to eliminate this, I split the games based on the average run-rates for individual grounds. I used 4.50 RPO as the basis for the split (simple because this gave me about 1,000 ODI s on either side). And here is what I came up with...

And, just to be absolutely sure that all the above graphs did indeed exhibit more or less similar characteristics, I merged all of them into one graph...
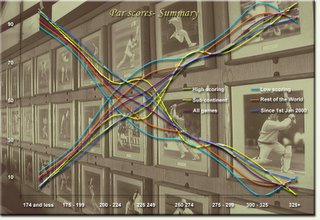
Funny enough, any which way you slice and dice this damn game, it does not seem to change. I am sure if I had picked up a random group of ODIs, I would have seen the same result. i.e., existence of some kind of par score, and either side of it, the game starts to get one sided.
Now, you may ask, so what, is this really a problem? In my opinion, yes, because given the 1st innings total, and with enough knowledge of the ground, era, etc, it becomes easy to predict the outcome of the game. And I am talking of games involving two evenly matched teams, (not Australia Vs Namibia kind).
And anyone need further convincing need not look any further then the last few games of the VB series being played in Australia. In fact, next time you sit down to watch a One-Day game; try to guess the result after the first innings is over. And see how many times you are correct.
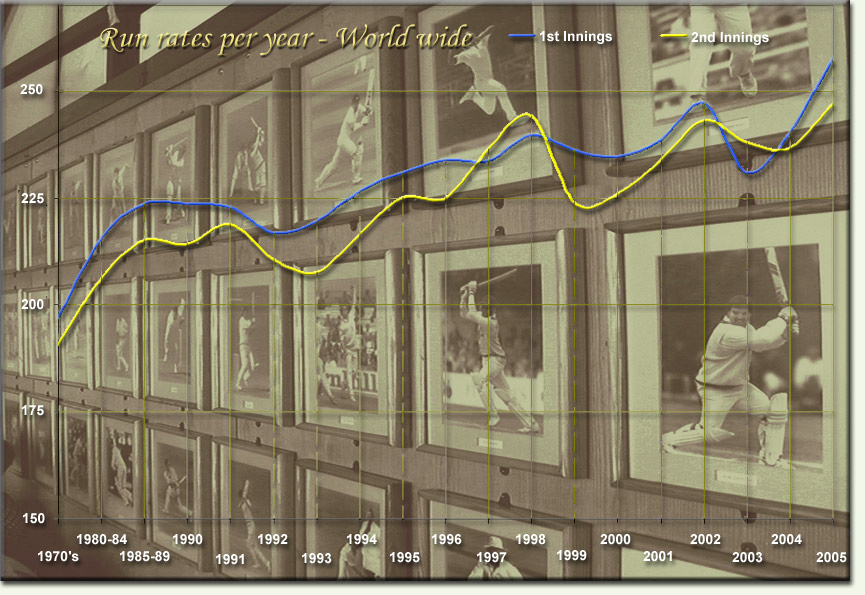
Now, logically speaking, if there is a par score, it implies that most 1st innings scores should be finishing around that score, no? Well, this is another aspect of this whole analysis that struck meas odd (and something i have not been able to understand). See the % of games that fall into these different "run-bands"...
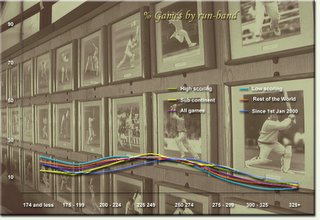
Talk about similarity here!!
Now, it would be appear that the ideal situation would be for more games to have the 1st innings scores around par score as it would be difficult to determine the result of those games. Frankly, this would make the whole game boring and the excitement would only kick-in at the death of the second innings (say 5-10 overs left). A bit like the 250-270 games we are so used to seeing in the sub-continent.
So is there another solution by which no matter what the situation of the game at the mid-point, it becomes difficult to predict the result? Or in other words, can the element of par be eliminated?
In my opinion, it can. But not by making flat pitches or introducing meaningless rules like Powerplays or Super-subs. All they do it increase the runs being scored in the game but, as I just proved, does not change the nature of the game...

Anyway, to understand how this par can be eliminated, I will need to compare ODIs with other "Set-target, Chase-target" kind of games like Test cricket and Baseball (actually, none other come to mind)!
And as a starting point, I will analyse how easy (or difficult) it is to determine the par score in Test cricket and why.
But that in my next post.
In the previous post, I had highlighted some of the most important attributes and also, in my opinion, flaws of the one day game, namely:
- There exists some kind of a par 1st innings score that gives both teams an equal chance of winning
- If the game moves away from this par score, the chances of winning and losing change dramatically. And so do the margins of victory and defeat.
Fair enough. Frankly, even I had my doubts before I started this analysis couple of weeks ago. Since then, I have analysed the One-day game to see if the above mentioned attributes do exist and are common to ODIs in general. I did this by grouping ODIs together based on different parameters.
First, here is a comparison of games played in this decade (2000 thru 2005) with all games played since 1971.
Note, as mentioned in my previous post, these graphs do not include games decided by the D/L (or similar) method, less than 45 overs (as they distort the numbers) and those that did not finish in a +ve result (i.e. "No Results" due to rain). Also note that in this (and all graphs), the line going from bottom left to top right represents the % times the team batting first has won after scoring the runs represented in the "x" axis, and vice versa. This gives us a par score (50% chance of winning or losing) where the lines intersect.
 (Please click on this and other graphs to enlarge)
As you can see, apart from the difference in the par score, both those graphs are similar. And as expected, the par score in the games is a bit higher for games played in this decade.
Now, given the fact that ODIs in the sub-continent are normally higher scoring than the rest of the world, I split the games between those played in the sub continent and elsewhere and did a similar comparison...

The sub-continental graph does appear "wonky" but on close inspection, it exhibits exactly what I am trying to prove, i.e. outside of the par score, the result becomes predictable, and in this case, its just more pronounced. And again, as expected the par score is higher for the sub-continental games. Guy who might still be holding their sheet of paper tick or cross your answers :-)
I was also aware that this split based on regional lines may not be correct, as not all grounds in the sub-continent are high scoring and vice versa. In order to eliminate this, I split the games based on the average run-rates for individual grounds. I used 4.50 RPO as the basis for the split (simple because this gave me about 1,000 ODI s on either side). And here is what I came up with...

And, just to be absolutely sure that all the above graphs did indeed exhibit more or less similar characteristics, I merged all of them into one graph...
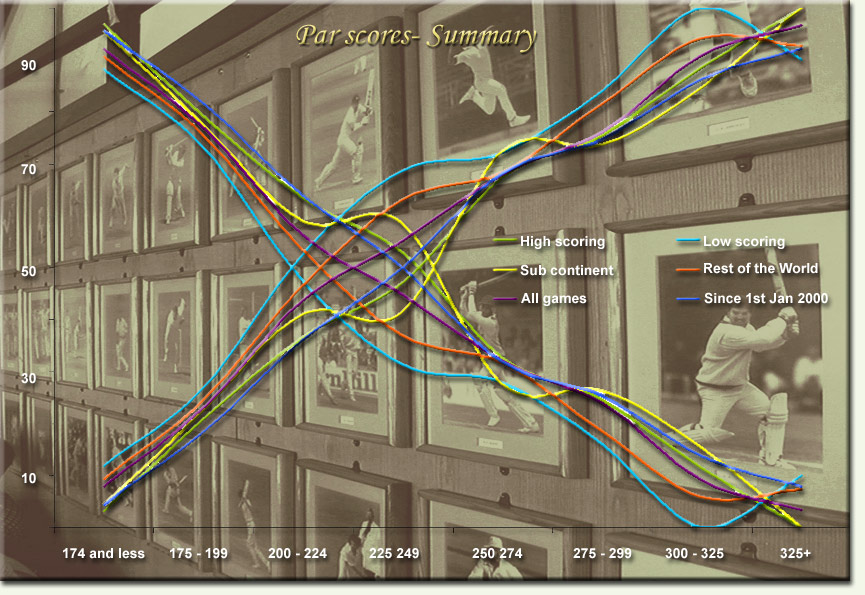
Funny enough, any which way you slice and dice this damn game, it does not seem to change. I am sure if I had picked up a random group of ODIs, I would have seen the same result. i.e., existence of some kind of par score, and either side of it, the game starts to get one sided.
Now, you may ask, so what, is this really a problem? In my opinion, yes, because given the 1st innings total, and with enough knowledge of the ground, era, etc, it becomes easy to predict the outcome of the game. And I am talking of games involving two evenly matched teams, (not Australia Vs Namibia kind).
And anyone need further convincing need not look any further then the last few games of the VB series being played in Australia. In fact, next time you sit down to watch a One-Day game; try to guess the result after the first innings is over. And see how many times you are correct.
Now, logically speaking, if there is a par score, it implies that most 1st innings scores should be finishing around that score, no? Well, this is another aspect of this whole analysis that struck meas odd (and something i have not been able to understand). See the % of games that fall into these different "run-bands"...

Talk about similarity here!!
Now, it would be appear that the ideal situation would be for more games to have the 1st innings scores around par score as it would be difficult to determine the result of those games. Frankly, this would make the whole game boring and the excitement would only kick-in at the death of the second innings (say 5-10 overs left). A bit like the 250-270 games we are so used to seeing in the sub-continent.
So is there another solution by which no matter what the situation of the game at the mid-point, it becomes difficult to predict the result? Or in other words, can the element of par be eliminated?
In my opinion, it can. But not by making flat pitches or introducing meaningless rules like Powerplays or Super-subs. All they do it increase the runs being scored in the game but, as I just proved, does not change the nature of the game...
Anyway, to understand how this par can be eliminated, I will need to compare ODIs with other "Set-target, Chase-target" kind of games like Test cricket and Baseball (actually, none other come to mind)!
And as a starting point, I will analyse how easy (or difficult) it is to determine the par score in Test cricket and why.
But that in my next post.
Friday, January 20, 2006
The Lahore Fiaso...
First spare a thought for the television companies who paid millions for the rights to telecast the Test match. Then a passing thought for millions of fans who wasted their time watching a meaningless sporting contest, and more importantly, the players who took part in one.
And finally, a casual thought for the curator and Inzaman who are getting their share of blame for this pitch.
And what about the greedy morons (BCCI, PCB, etc) who decided that it would be a great idea to schedule a Test inLahore
If they lacked local knowlegde of the weather, maybe they should have checked the dates when Tests have been scheduled in Lahore in the past...
 (click on image to enlarge).
For those of you wondering what happened to the only other Test Match that was played in January, check this. And yes, it was the poor Kiwis who decided that losing a Test match inside 3 days was better than sweating it out for 5 in the first week of May in the sub-continent.
And finally, a casual thought for the curator and Inzaman who are getting their share of blame for this pitch.
And what about the greedy morons (BCCI, PCB, etc) who decided that it would be a great idea to schedule a Test in
If they lacked local knowlegde of the weather, maybe they should have checked the dates when Tests have been scheduled in Lahore in the past...
 (click on image to enlarge).
For those of you wondering what happened to the only other Test Match that was played in January, check this. And yes, it was the poor Kiwis who decided that losing a Test match inside 3 days was better than sweating it out for 5 in the first week of May in the sub-continent.
Like I said before, scheduling Test matches is a science, but rocket science…
Thursday, January 19, 2006
These damn schedules again...
Even though I am loaded with work at the moment, the moment I see schedules, shambles, BCCI, ICC and more shambles all rolled in the space of a hours, my eyes light up.
Why do we keep going around in circles as far as this scheduling is concerned. How difficult can it be to get 10 nations to play each other on a consistent basis?
Frankly, any sensible person could spend a weekend and come up with something more sensible that what the ICC and the various boards will ever come up with. After all, its not rocket science.
But I said "sensible"…
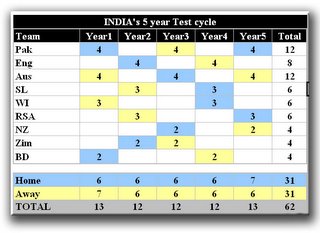
Anyway, just to prove a point, I spent all of 10 minutes (in the middle of a very busy morning) and came up with this simple schedule for India that takes into consideration what India want (i.e. play more against Australia , England and Pakistan ) without upsetting the ICC Test Cycle.
(click on image to enlarge)
And in those 10 minutes, I also had time to colour code this damn thing!
I now things are not as simplistic, but I also feel that there is nothing that cannot be achieved by sitting down on a table and discussing things.
Just make sure you have a laptop with Microsoft Excel loaded on it...
Why do we keep going around in circles as far as this scheduling is concerned. How difficult can it be to get 10 nations to play each other on a consistent basis?
Frankly, any sensible person could spend a weekend and come up with something more sensible that what the ICC and the various boards will ever come up with. After all, its not rocket science.
But I said "sensible"…
Anyway, just to prove a point, I spent all of 10 minutes (in the middle of a very busy morning) and came up with this simple schedule for India that takes into consideration what India want (i.e. play more against Australia , England and Pakistan ) without upsetting the ICC Test Cycle.

(click on image to enlarge)
And in those 10 minutes, I also had time to colour code this damn thing!
I now things are not as simplistic, but I also feel that there is nothing that cannot be achieved by sitting down on a table and discussing things.
Just make sure you have a laptop with Microsoft Excel loaded on it...
Wednesday, January 18, 2006
Predicting the Predictable
Now that I have contracted Foot in Mouth disease for suggesting that Test cricket is better of because of boring draws, I should refrain from discussing the virtues of Test cricket. Though I do hope by this time next week order is restored and we can talk of dull boring draws on dead pitches as a thing of the past.
(click on this and other images to enlarge)
Anyway, this post is more to do about the One-Day game and less to do with Test cricket (though they are related in a vague sort of way).
Before reading any further, ask yourself this question; when you sit down to watch a one day game does a par score cross your mind, i.e., a score after the first innings that gives both Teams an equal chance of winning? And after the 1st innings is over, do you have a gut feeling as to who will win (or lose) the game? And are you more often right then wrong?
If the answer to all these questions is no, then you haven'’t watched enough one day cricket, but read on nevertheless J
And if the answer is yes, then welcome to the club. In this case, pick up a pen and paper and write down the rough par scores that come to your mind based on all* ODIs played:
- World wide since the early 70'’s
- World-wide since
- In the sub continent
- Outside the sub continent
* Excluding games decided by D/L (or similar) method, less than 45 overs (as they distort the numbers) and those that did not result in a +ve result (mainly due to rain, but occasional Ties)
I am looking for four answers here (one for each) but let me clarify, I do not expect anyone to come up with accurate answers. The main idea (apart from a bit of fun) is to see if such numbers do spring to mind.
Now to proceed. I had mentioned in one of my earlier posts that higher the 1st innings score, the more the chances of the team winning. As a refresher, here is the graph from that post (ignore the comparison with Test cricket for the moment) …
(click on this and other images to enlarge)
And since we know that in the one day game, unless there is rain interruption or a tie (which is very rare), if you are not winning, you are losing. If we exclude these '“No Result' games, the losing line is a mirror of the winning line, we get a graph in which the lines cross each other at the 50% mark (donating a point when the chance of winning or losing is equal, or at Par).

(Based on all* Games world wide)
And there is another striking aspect of the game; not only does the chance of winning (or losing) change dramatically once you move from the par score, the margins of victory (or defeat) also change dramatically.

(please note, I have used nr of balls left as the margin of victory if Team batting 2nd wins as opposed to the traditional wickets margin).
Now, in my opinion, these graphs highlight some of the most important attributes (and also flaws) of the One day game:
- Some kind of par score exits
- It exists EXACTLY in the middle of the game
- If the game moves away from this par score, the chances of winning and losing change dramatically. And so do the margins of victory and defeat.
So the moment the 1stinnings score moves away from the par score, its starts becoming predictable move. So how many games finish around the par score and how many out side it?

As you can see, only about 25% -30% games do finish around the par score. So about 70-75% games finish outside the par score and the further they are from that score, the more one sided they get.
Now, in the ideal world, it would be great if all games finished around the par score. But that would mean that the 1st Innings would be come predictable and boring J We can'’t win, can we…
Anyway, got to rush now. Travelling, work etc will keep me away for a couple of days.
But don't throw away your tiny sheet of par scores as we still need to find out how the game has changed in the last few years and how sub continental games differ from elsewhere. And feel free to revise those scores. After all, there are no prizes for guessing correctly J
Subscribe to:
Posts (Atom)